Matplotlib
不多解释,python 超强的可视化工具,学就完事儿了,参考 official tutorial
Usage Guide
A simple example
Matplotlib 的图都是在 Figures 上绘制的,每个 Figure 都可以包含一个或多个 Axes。然后我们可以使用 Axes.plot 在轴上绘制一些数据,使用 axes 创建图形的最简单方法是使用pyplot.subplots (Axes 概念比较抽象,这里就把它们当作一个个的子图好了,subfigure)
import matplotlib.pyplot as plt
import numpy as np

fig, ax = plt.subplots()  ## Create a figure containing a single axes.
ax.plot([1, 2, 3, 4], [1, 4, 2, 3])  ## Plot some data on the axes.

# plt.show()
这种方式取名叫 object-oriented style or OO-style
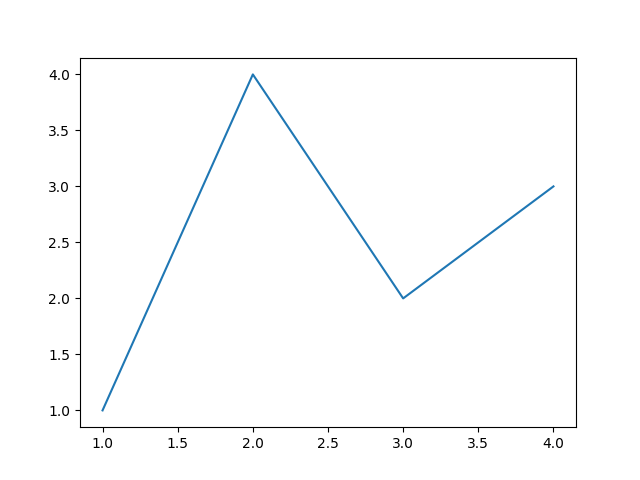
除了使用 Axes 绘图以外,matplotlib 还可以使用 plt.plot() 进行绘图,它会在“当前” Axes 上执行该绘图,如果它们不存在则创建该 Axes,所以上面的图像可以用下面的代码
plt.plot([1, 2, 3, 4], [1, 4, 2, 3]) ## Matplotlib plot.为这种方式取名叫 pyplot-style 目前比较流行这种方式,同时现在也不推荐使用 pylab 进行绘图
Matplotlib basic concept
Figure
可以把 figure 当成一个画布,这个画布可以画任意数量的 Axes
Axes
把 Axes 当成一个小画布
Axis
可以理解为图像里的坐标轴,确定函数取值范围
Artist
基本上任何你看到的东西都是 artist 类,包括 Text objects, Axes, Line2D objects…所有的 artist 都会被画到画布中
最好使用 numpy.array 作为函数的输入,其他类型的变量可能不能很好地处理
Interactive mode
可以使用交互模式,看到每一个画图的效果,可以使用 ipython 进行交互
import matplotlib.pyplot as plt
plt.ion()
plt.plot([1.6, 2.7])
## a window should show

plt.title("interactive test")
plt.xlabel("index")
如果是没有指明交互模式,则需要使用 plt.show() 让绘制的图像显示
Performance
如果感觉渲染得很慢的话,可以是使用 fast style
import matplotlib.style as mplstyle
mplstyle.use('fast')
如果有多个 style 的话,确保 fast style 在最后,以保证不被其他 style 修改
Pyplot tutorial
matplotlib.pyplot 包含了各种各样的接口,能够让用户轻松地绘图,下面引用一下官方文档
Each
pyplotfunction makes some change to a figure: e.g., creates a figure, creates a plotting area in a figure, plots some lines in a plotting area, decorates the plot with labels, etc.It keeps track of things like the current figure and plotting area, and the plotting functions are directed to the current axes.
Intro to pyplot
绘制简单映射函数 $y = f(x)$ 图像可以使用 plt.plot,详细内容推荐 plot doc
import matplotlib.pyplot as plt
plt.plot([1, 2, 3, 4])
plt.ylabel('some numbers')
plt.show()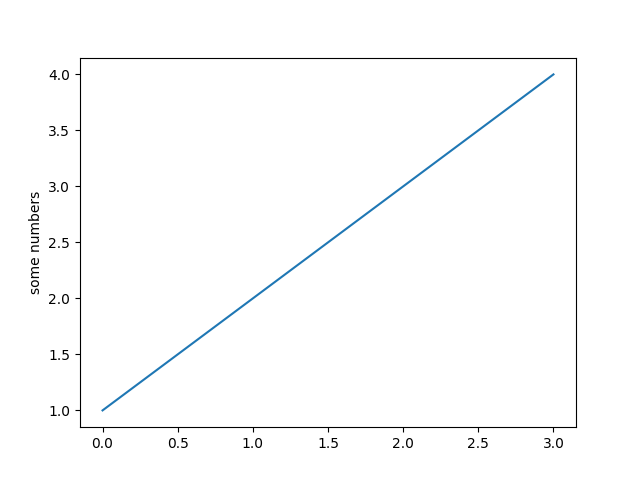
只传入一个参数,自动使用其 index 作为 x 轴,常用公式为如下
plt.plot(x=, y=, fmt='b-')
# fmt 代表 format 'b-' 代表蓝色直线,为默认值,其它 format 如 'ro' 代表红色圆点
# x, y 可以是二维的,这样将绘画多个函数图像
Formatting the style of your plot
实际上 plt.plot 可以接受任意多的参数,以绘画任意多个函数图像
import numpy as np

# evenly sampled time at 200ms intervals
t = np.arange(0., 5., 0.2)

# red dashes, blue squares and green triangles
plt.plot(t, t, 'r--', t, t**2, 'bs', t, t**3, 'g^')
plt.show()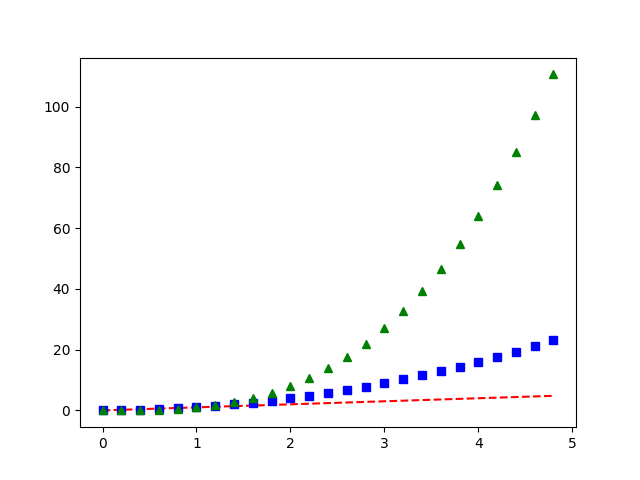
Plotting with keyword strings
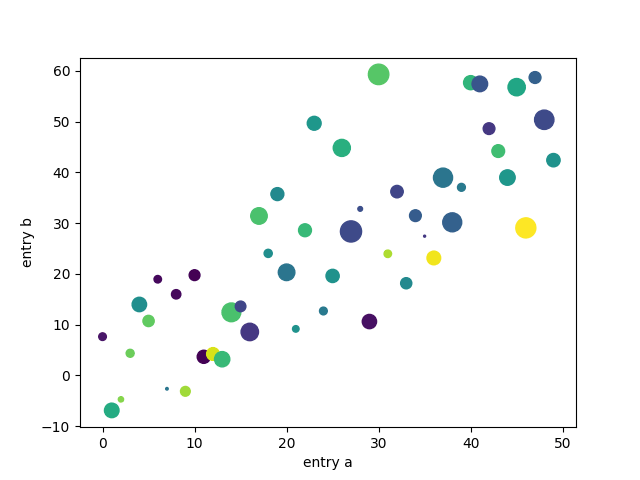
如果有 data_dict 存放着数据,则可以直接通过 data_dict 和其中的关键字绘图,下面使用了 plt.scatter 来绘制一个散点图,scatter doc
data = {'a': np.arange(50),
        'c': np.random.randint(0, 50, 50),
        'd': np.random.randn(50)}
data['b'] = data['a'] + 10 * np.random.randn(50)
data['d'] = np.abs(data['d']) * 100

plt.scatter('a', 'b', c='c', s='d', data=data)
# [c]olor, [s]ize
plt.xlabel('entry a')
plt.ylabel('entry b')
plt.show()
图像如下,可以看到散点的颜色和大小也是由 data 字典中的 c & d 决定的
Working with multiple figures and axes
pyplot 有一个 current figure/axes 概念,也就是当前在哪个画布上绘制哪个图像,下面就展示如何绘制两个子图
def f(t):
    return np.exp(-t) * np.cos(2*np.pi*t)

t1 = np.arange(0.0, 5.0, 0.1)
t2 = np.arange(0.0, 5.0, 0.02)

plt.figure()		# 创建 figure,optional,创建子图的时候也会自动创建
plt.subplot(211)	# 指向子图 (2, 1, 1)
plt.plot(t1, f(t1), 'bo', t2, f(t2), 'k')

plt.subplot(212)	# 创建子图 (2, 1, 2)
plt.plot(t2, np.cos(2*np.pi*t2), 'r--')
plt.show()
我们可以把 plt 看作一个指针或者画笔,它将指向你将绘图的地方
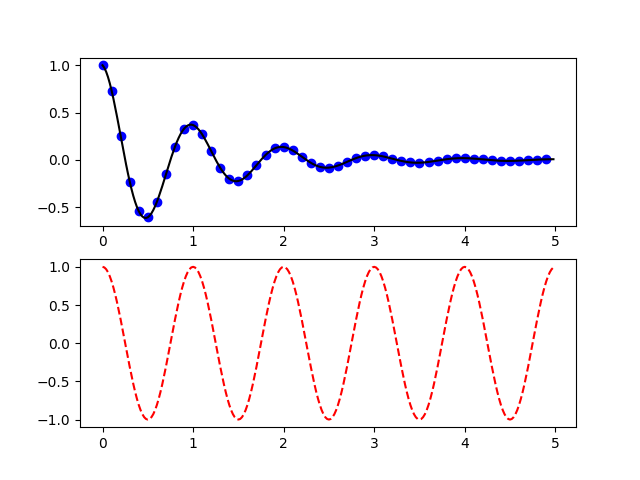
其中的 211 & 212 代表什么呢?这其实是 (2, 1, 1) 的简写,subplot(2, 1, 1) 也是一样的效果,三个数字分别表示:num_rows, num_cols, plot_number,其中 plot_number 是一个范围为 1~num_rows * num cols 的数字,能够定位在哪个子图上绘画
下面的代码展示了绘画多个 figure & subplot
import matplotlib.pyplot as plt
plt.figure(1)                # the first figure
plt.subplot(211)             # the first subplot in the first figure
plt.plot([1, 2, 3])
plt.subplot(212)             # the second subplot in the first figure
plt.plot([4, 5, 6])


plt.figure(2)                # a second figure
plt.plot([4, 5, 6])          # creates a subplot() by default

plt.figure(1)                # figure 1 current; subplot(212) still current
plt.subplot(211)             # make subplot(211) in figure1 current
plt.title('Easy as 1, 2, 3') # subplot 211 title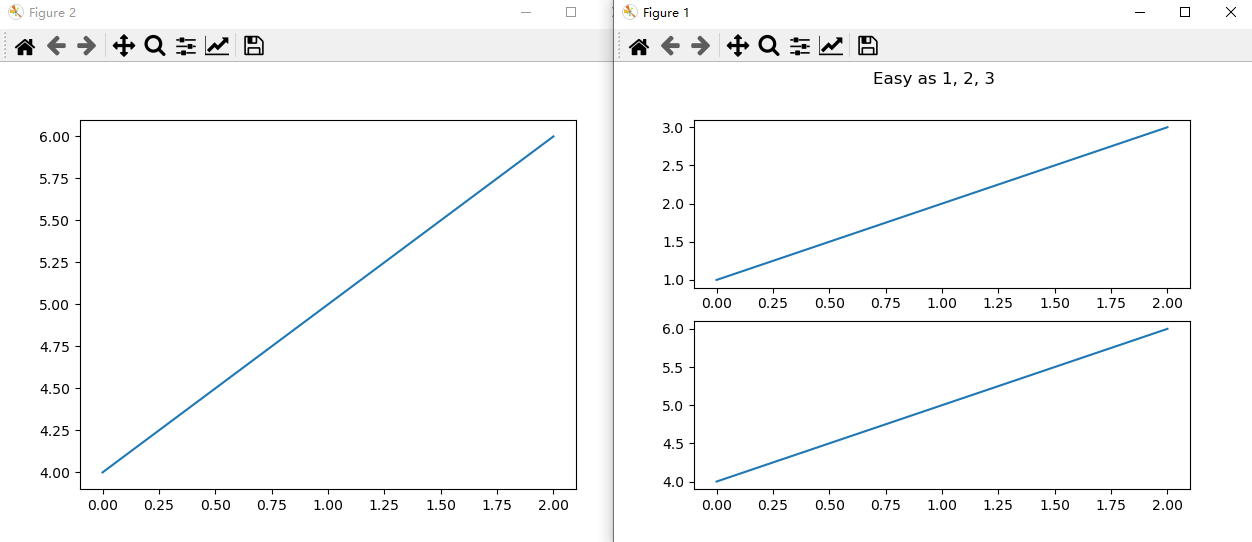
还有一个常用的操作 plt.gca() 代表获得当前 axes (get current axes)
Plotting with categorical variables
x 轴不仅可以是 number 还可以是字符串序列 names
names = ['group_a', 'group_b', 'group_c']
values = [1, 10, 100]

plt.figure(figsize=(9, 3))				# 画布大小

plt.subplot(131)
plt.bar(names, values)
plt.subplot(132)
plt.scatter(names, values)
plt.subplot(133)
plt.plot(names, values)
plt.suptitle('Categorical Plotting')	# 给 Figure 添加标题
plt.show()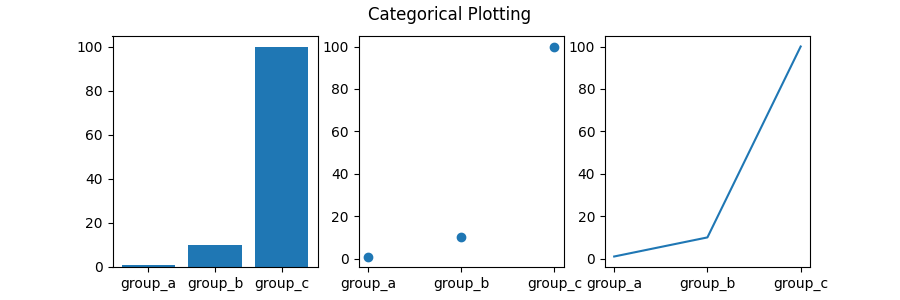
Controlling line properties
可以对 plot 出来的线条的属性进行设置,例如通过 plt.setp() 方法。实际上 plt.plot() 返回的是一个 Line2D 对象组成的列表,本质上是对 Line2D 对象的属性进行更改 Line2D doc
# 直接在 plot 方法中进行修改
plt.plot(x, y, linewidth=2.0)

# 使用 plt.step()
line_1, line_2 = plt.plot(x1, y1, x2, y2)
# use keyword args
plt.setp(lines, color='r', linewidth=2.0)
# or MATLAB style string value pairs
plt.setp(line_1, 'color', 'r', 'linewidth', 2.0)
Working with text
通过 text 方法可以为 figure 添加文字,通过 xlabel, ylable, title 等方法可以给 figure 添加坐标轴标签以及标题,text doc xlabel doc, ylabel doc and title doc
mu, sigma = 100, 15
x = mu + sigma * np.random.randn(10000)

# the histogram of the data
n, bins, patches = plt.hist(x, 50, density=1, facecolor='g', alpha=0.75)


plt.xlabel('Smarts')
plt.ylabel('Probability')
# 给 Axes 设置标题,区别于 plt.title()
plt.title('Histogram of IQ')
plt.text(60, .025, r'$\mu=100,\ \sigma=15$')
plt.axis([40, 160, 0, 0.03])	# 对轴进行设置
plt.grid(True)					# 格点设置
plt.show()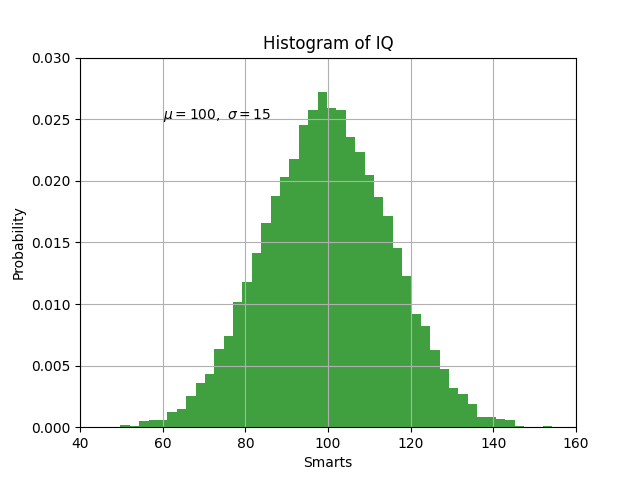
所有的文字对象都可以像
Line2D一样进行属性设置t = plt.xlabel('my data', fontsize=14, color='red')可以使用 Latex 语法进行数学公式的书写
plt.title(r'$\sigma_i=15$')
Annotating text
通过 plt.annotate 对图像中的某个点进行标记
ax = plt.subplot()

t = np.arange(0.0, 5.0, 0.01)
s = np.cos(2*np.pi*t)
line, = plt.plot(t, s, lw=2)

plt.annotate('local max', xy=(2, 1), xytext=(3, 1.5),
             arrowprops=dict(facecolor='black', shrink=0.05),
             )

plt.ylim(-2, 2)
plt.show()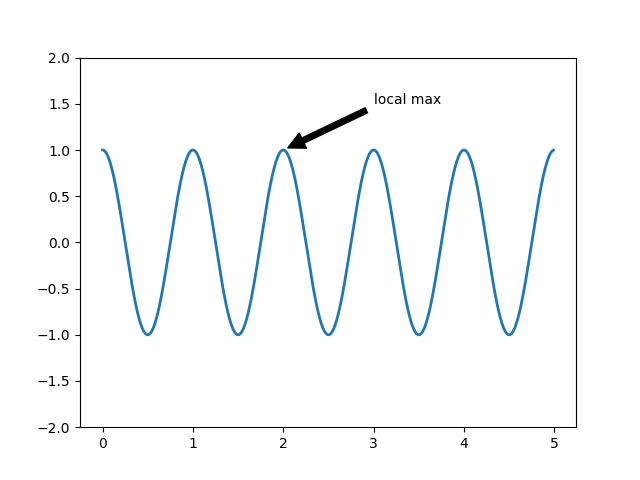
Nonlinear axes
可以对坐标轴进行缩放,例如对数缩放 plt.xscale('log') 更多就不再叙述了,可以直接参考 tutorial
保存图片
使用 plt.savefig('path\name') 即可
总结
以上就是一些 matplotlib.pyplot 中的基础概念,掌握了基本逻辑过后,就可以通过查询文档进行更多的操作了,放两个参考链接
Matplotlib Cheat Sheet,查看一些代号很方便
TODO
整理一些常用的 api 操作


