Matplotlib 拓展
pyplot api doc 放一个 api 链接,便于查找 api
Axis limit
有两个推荐的方法
plt.xlim(left, right),xlim docplt.axis([xmin, xmax, ymin, ymax]),axis doc,通过plt.axis(False)也可以不显示坐标轴及其标签
axis 除了范围可以设置,其 tick 也可设置,plt.xticks(ticks=, labels=) xticks doc
补充:将 y 轴进行反转 plt.gca().invert_yaxis()
Text
pyplot API |
OO API | description |
|---|---|---|
text |
text |
Add text at an arbitrary location of the Axes. |
annotate |
annotate |
Add an annotation, with an optional arrow, at an arbitrary location of the Axes. |
xlabel |
set_xlabel |
Add a label to the Axes‘s x-axis. |
ylabel |
set_ylabel |
Add a label to the Axes‘s y-axis. |
title |
set_title |
Add a title to the Axes. |
figtext |
text |
Add text at an arbitrary location of the Figure. |
suptitle |
suptitle |
Add a title to the Figure. |
这些应该都返回一个 Text 文字对象,当然也拥有 Text 对象的各个属性,下面列举一些常用的属性
colorfontsizefontweight调整字体粗细 ‘ultralight’, ‘light’, ‘normal’, ‘regular’, ‘bold’, ‘extra bold’, ‘black’fontfamily规定字体家族,可以更改字体fontstyle可以使用斜体italicalpha透明度,0~1之间,1为完全不透明bbox给文字增加外框,其值为一个字典,常用dict(boxstyle='', facecolor='', edgecolor=''),其中boxstyle取值请参考 link,默认为 square 也常用 round
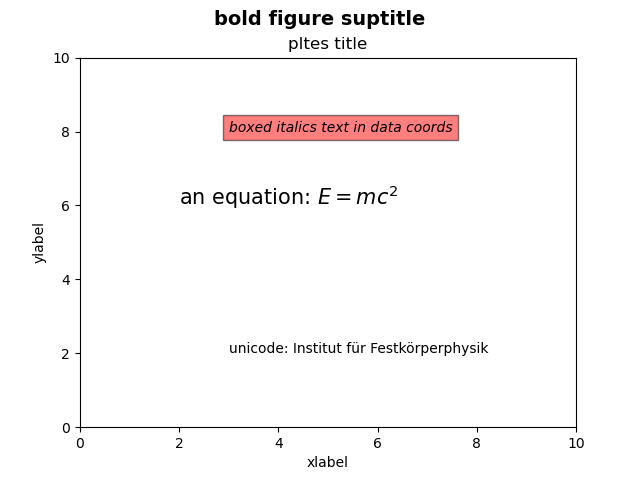
下面看看这些 API 有哪些必要参数,通过一个例子了解
import matplotlib
import matplotlib.pyplot as plt

fig = plt.figure()

# Set titles for the figure and the subplot respectively
plt.suptitle('bold figure suptitle', fontsize=14, fontweight='bold')
plt.title('pltes title')

plt.xlabel('xlabel')
plt.ylabel('ylabel')
# Set both x- and y-pltis limits to [0, 10] instead of default [0, 1]
plt.axis([0, 10, 0, 10])

plt.text(3, 8, 'boxed italics text in data coords', style='italic',
        bbox={'facecolor': 'red', 'alpha': 0.5})

plt.text(2, 6, r'an equation: $E=mc^2$', fontsize=15)

plt.text(3, 2, 'unicode: Institut für Festkörperphysik')
plt.show()
Legend & annotate
label 其实是各个 Artist 对象都拥有的属性,在使用 plt.plot() 类似的方法来绘图的时候,可以直接在参数里使用 label= 以创造该绘图对象的标签。而 legend 可以用于将 label 以图例形式加入到 figure 当中,参考 知乎, legend doc, about matplotlib.rcParams
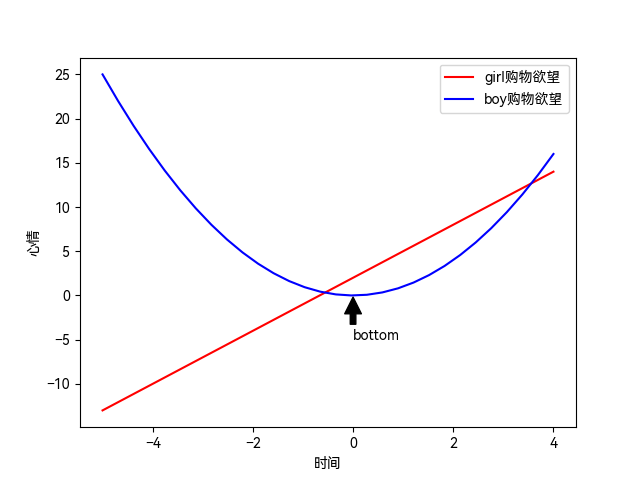
也可以对图像中的某些点进行标记,使用 annotate() 方法即可,annotate doc
import matplotlib.pyplot as plt
import numpy as np
# 设置默认字体以显示中文
plt.rcParams['font.family'] = ['HarmonyOS Sans SC']

n = np.linspace(-5, 4, 30)
m1 = 3 * n + 2
m2 = n ** 2

plt.xlabel('时间')
plt.ylabel('心情')

line1, = plt.plot(n, m1, color='r', linewidth=1.5, linestyle='-', label='女生购物欲望')
line2, = plt.plot(n, m2, 'b', label='男生购物欲望')

plt.legend(handles=[line1, line2], labels=['girl购物欲望','boy购物欲望'], loc='best')

plt.annotate('bottom', xy=(0, 0), xytext=(0, -5), arrowprops=dict(color='black', shrink=0.05))

plt.show()
Image
在目标检测中,经常使用 bbox 对目标进行框选,并进行类别标注,这些都是可以通过 matplotlib 做到的。一般的图像在计算机视觉中,被处理为一个 (H, W, C) 的三维张量,其中 C 通常为 3,在 matplotlib 中可以使用 matplotlib.image 包处理图像,然后使用 plt.imshow() 绘制图像,imshow doc
import matplotlib.pyplot as plt
import numpy as np
import matplotlib.image as mpimg

img = mpimg.imread('test.png')
# img = plt.imread('test.png')
plt.imshow(img)
plt.show()

# 修改原点
plt.imshow(img, origin='lower')
plt.show()

# 修改透明度
plt.imshow(img, alpha=0.5)
# 在 img 上绘图
x = np.arange(img.shape[1])
k = img.shape[0] / img.shape[1]
y = k * x
plt.plot(x, y, color='red')
plt.show()
除了绘制函数,一般的几何图形也能够绘制,一般使用 patches 对象,具体操作可参考 简书


